

Data Analysis and Graphics Using R: A Hands-On Guide to Statistical Computing and Visualization by John Maindonald
Inclusive of all applicable taxes. FREE shipping on all orders.
Available Offers
- 🚚Free Delivery — Free shipping on all orders
- 💵Cash on Delivery — Pay when your order arrives
- ↩️15-Day Easy Returns — Hassle-free return policy
- 🔒Cash on Delivery — Pay safely when your order arrives
Check Delivery
Product Description
Introduction
Data analysis is the backbone of modern research, and R has emerged as one of the most powerful and versatile tools for statistical computing and graphics. Data Analysis and Graphics Using R, authored by John Maindonald and published by Cambridge University Press, is a comprehensive guide that takes you from the fundamentals of the R environment to advanced analytical techniques. Whether you are a student, a research scientist, or a practicing statistician, this hardbound edition offers a hands-on approach to understanding data through real-world examples and clear, practical instruction. For Indian readers and learners navigating the growing field of data science, this book serves as an essential resource for mastering R and applying it to diverse datasets.
Book Overview
This third edition of the classic text builds upon the strengths of its predecessors while introducing new topics that reflect the evolving landscape of data analysis. The book begins with an introduction to the R system, covering basic operations, data structures, and graphical capabilities. It then progresses through standard regression methods, including linear and generalized linear models, before delving into more advanced subjects such as Bayesian inference for regression, errors-in-variables models, generalized linear mixed models, and random forests. Every chapter is supported by worked examples drawn from real research, accompanied by detailed commentary that explains not just the steps but the reasoning behind them. A companion website provides all the code and datasets, enabling readers to reproduce every analysis and practice with exercises.
Key Highlights
- Comprehensive Coverage: From R basics to cutting-edge techniques like random forests and Bayesian regression, this book spans the entire spectrum of data analysis.
- Real-World Examples: Each concept is illustrated with authentic research data, making the material directly applicable to your own work.
- Hands-On Learning: The emphasis is on doing—readers are guided through code, graphs, and interpretation, not just theory.
- Updated Third Edition: New chapters on Bayesian inference, errors in variables, generalized linear mixed models, and random forests keep the content current.
- Reproducible Research: All datasets and R code are available online, allowing you to follow along and verify results.
Inside the Book
The book is structured to build confidence gradually. Early chapters introduce the R environment, data input, and basic plotting. Subsequent chapters cover linear regression, analysis of variance, logistic regression, and survival analysis. Later sections explore multivariate methods, time series, and spatial data. The final chapters address advanced topics such as Bayesian approaches, mixed-effects models, and machine learning techniques like random forests. Each chapter concludes with exercises that reinforce learning, with selected solutions provided online.
Key Topics
- Introduction to R: data types, functions, and graphics
- Linear and generalized linear models
- Bayesian inference for regression
- Errors-in-variables models
- Generalized linear mixed models
- Random forests and ensemble methods
- Graphical display and interpretation of data
- Reproducible research practices
Reader Benefits
By working through this book, you will gain the ability to confidently analyze complex datasets using R. You will learn to create publication-quality graphics, interpret statistical outputs, and make data-driven decisions. The practical exercises will sharpen your problem-solving skills, while the real-world examples will help you see how statistical methods are applied in fields such as biology, economics, social sciences, and engineering. The book also serves as a lasting reference, with detailed explanations that you can revisit as your skills grow.
Learning Outcomes
- Master the R programming environment for data manipulation and visualization
- Apply linear and generalized linear models to real data
- Implement Bayesian regression and interpret posterior distributions
- Handle measurement error using errors-in-variables models
- Fit generalized linear mixed models for hierarchical data
- Build random forest models for prediction and classification
- Produce clear, informative graphics that communicate findings effectively
Who Should Read
This book is ideal for research scientists, final-year undergraduate and graduate students in applied statistics, and practicing statisticians who want to deepen their understanding of R. It assumes basic statistical knowledge and some experience with data analysis, but no prior exposure to R is necessary. Indian students preparing for careers in data science, analytics, or academic research will find this book particularly valuable as it bridges theory and practice with clarity.
About the Author
John Maindonald is a distinguished statistician and author with decades of experience in statistical consulting and teaching. He has worked extensively with researchers across disciplines, helping them apply statistical methods to real-world problems. His expertise in R and data analysis is reflected in the practical, example-driven approach of this book. He is also known for his contributions to statistical computing and for making complex topics accessible to a broad audience.
About the Publisher
Cambridge University Press is a globally respected academic publisher with a long tradition of producing high-quality scholarly works. Known for its rigorous editorial standards and commitment to excellence, Cambridge University Press brings you this definitive guide to data analysis with R. This hardcover edition is built to last, making it a reliable companion for years of study and reference.
Conclusion
Data Analysis and Graphics Using R is more than a textbook—it is a practical toolkit for anyone who works with data. With its clear explanations, real-world examples, and updated content on modern statistical methods, this book empowers you to harness the full potential of R. Whether you are starting your journey in data science or looking to expand your analytical toolkit, this volume from Cambridge University Press is an investment that will pay dividends in your research and career. Add it to your library today and unlock the power of data.
Quick Summary
Data Analysis and Graphics Using R by John Maindonald is a comprehensive, hands-on guide that introduces readers to the powerful R system for statistical computing and data visualization. Written for research scientists, graduate students, and practising statisticians, the book covers standard regression methods and progresses to advanced topics like generalized linear models and mixed-effects models. What sets this book apart is its emphasis on practical analysis, graphical display, and interpretation of real-world data. Each chapter includes worked examples from actual research, accompanied by clear commentary explaining the reasoning behind each step. The companion website provides all code and datasets, allowing readers to reproduce analyses and practice independently. Assuming only basic statistical knowledge and no prior R experience, this book builds confidence and competence in data analysis. For Indian students and researchers, it serves as an ideal textbook for applied statistics courses and self-study. By purchasing from Bookshops.in, you get a genuine hardcover edition with fast, reliable delivery across India, making it a valuable addition to your academic library.
Book Highlights
Book Specifications
| ISBN-13 | 9780521762939 |
| ISBN-10 | 0521762936 |
| Publisher | Cambridge University Press |
| Language | English |
| Dimensions | 18.42 x 3.18 x 25.4 cm |
| Weight | 1 kg 300 g |
| Country | India |
| Category | Research › Biostatistics |
| Genre | Non-fiction |
| Original Language | English |
Frequently Asked Questions
What is the main focus of Data Analysis and Graphics Using R?
Do I need prior experience with R to use this book?
Is this book suitable for Indian university courses?
What kind of examples are included in the book?
Are there online resources available with this book?
What topics in R are covered beyond basic regression?
How is this book different from other R textbooks?
Is the book available in hardcover?
Who is the author of this book?
Can this book help me prepare for a data science career?
Does the book include exercises for practice?
What is the language of the book?
Where can I buy this book in India?
Readers Also Search For
Customers Also Bought
Research
Mathematical Modeling of Biological Systems, Volume I (English, Andreas Deutsch | Lutz Brusch | Helen Byrne)
Research
Intermediate Statistics (English, James P. Stevens)
Research
Statistics Explained by Steve McKillup – Life Science Statistics Guide
Research
Applied Longitudinal Data Analysis (English, Judith D. Singer | John B. Willett)
Research
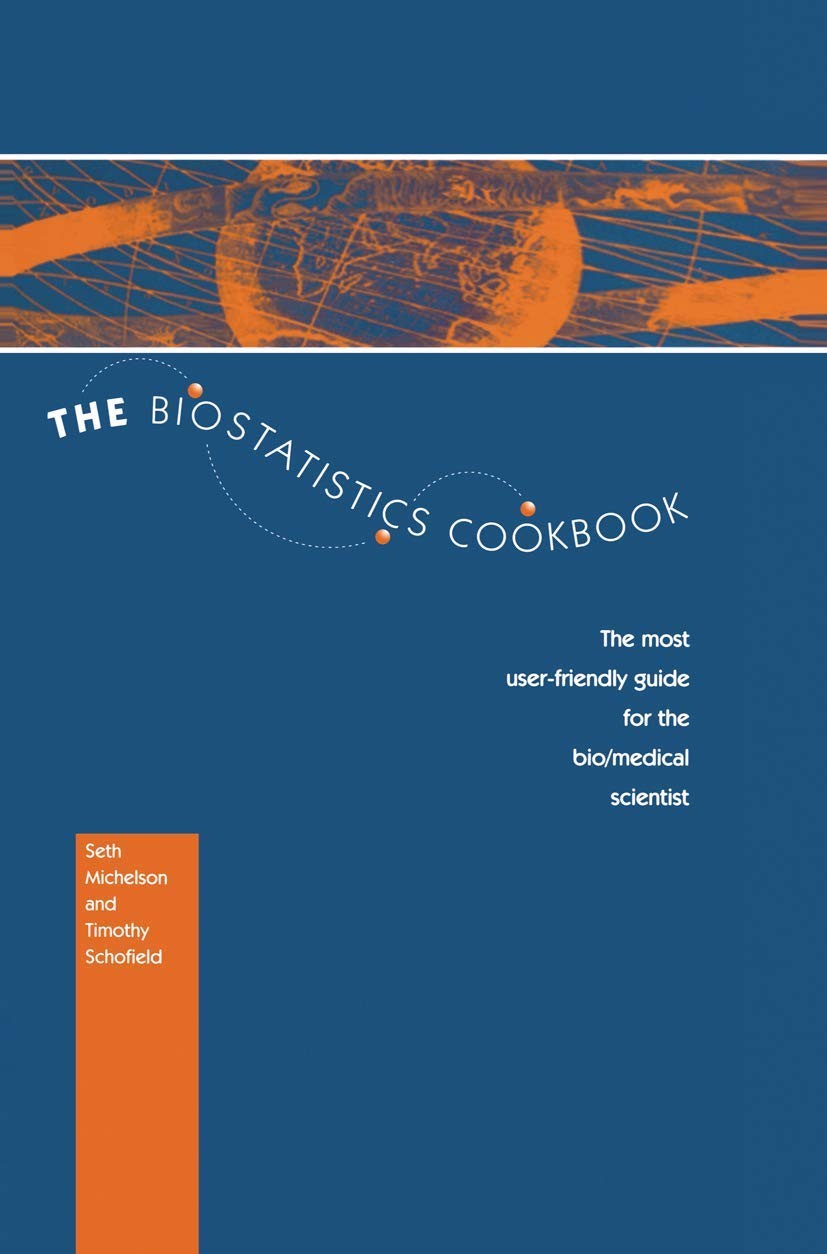
The Biostatistics Cookbook (English, S. Michelson | T. Schofield)
Research
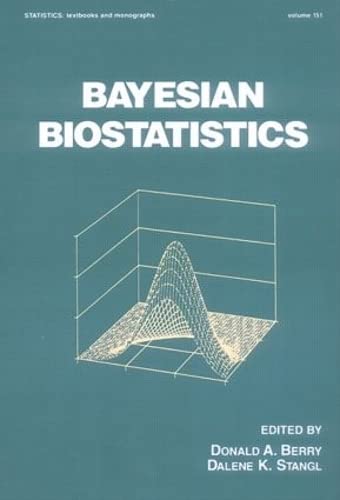
Bayesian Biostatistics (STATISTICS, A SERIES OF TEXTBOOKS AND MONOGRAPHS)
Related Products
View AllResearch
Mathematical Modeling of Biological Systems, Volume I (English, Andreas Deutsch | Lutz Brusch | Helen Byrne)
Research
Intermediate Statistics (English, James P. Stevens)
Research
Statistics Explained by Steve McKillup – Life Science Statistics Guide
Research
Applied Longitudinal Data Analysis (English, Judith D. Singer | John B. Willett)
Research
The Biostatistics Cookbook (English, S. Michelson | T. Schofield)
Research