
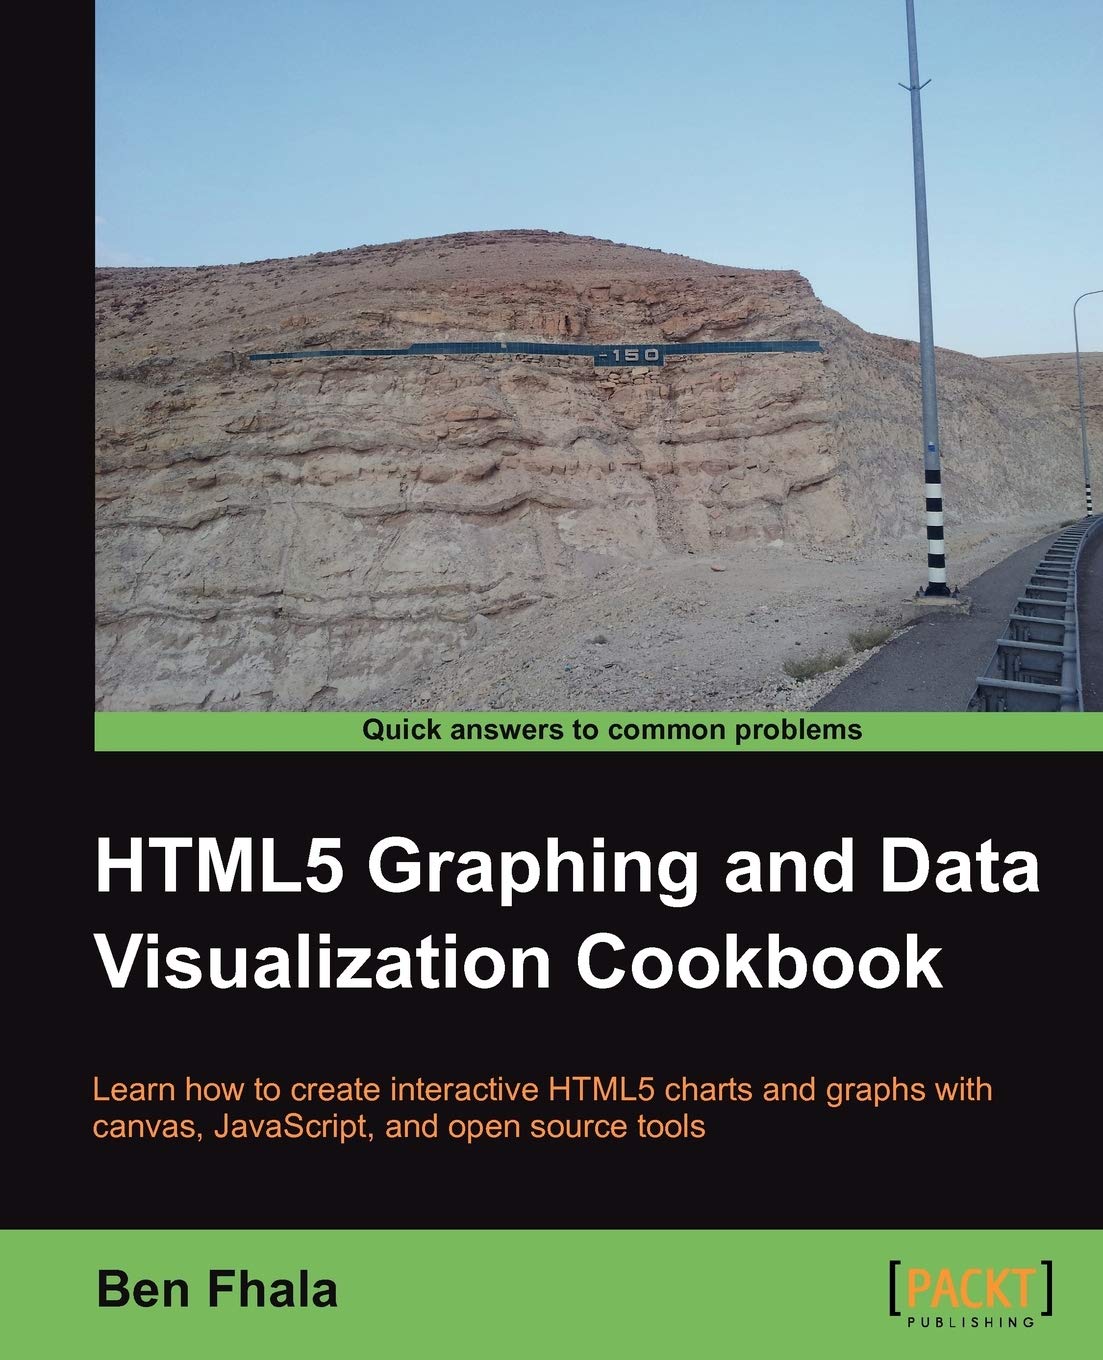
HTML5 Graphing and Data Visualization Cookbook: Learn to Create Interactive HTML5 Charts and Graphs with Canvas, JavaScr
Inclusive of all applicable taxes. FREE shipping on all orders.
Available Offers
- 🚚Free Delivery — Free shipping on all orders
- 💵Cash on Delivery — Pay when your order arrives
- ↩️15-Day Easy Returns — Hassle-free return policy
- 🔒Cash on Delivery — Pay safely when your order arrives
Check Delivery
Product Description
Introduction
Data visualization is a powerful way to tell stories, uncover trends, and make complex information instantly understandable. In a world driven by data, the ability to create interactive, dynamic charts and graphs directly in the browser is an invaluable skill. HTML5 Graphing and Data Visualization Cookbook by Ben Fhala is your practical guide to mastering this craft. Published by Packt Publishing, this hardcover edition is designed for Indian developers, students, and tech enthusiasts who want to build stunning visualizations using HTML5 Canvas, JavaScript, and open source tools. Whether you are a beginner or an experienced coder, this cookbook offers step-by-step recipes that transform raw data into engaging, animated graphics.
Book Overview
This book is structured as a cookbook, meaning each chapter presents a series of practical, ready-to-use recipes. The content progresses linearly, so you can read it from start to finish or jump directly to a specific task. You do not need a deep background in HTML5 or Canvas, but a basic understanding of HTML and some coding experience (preferably in JavaScript) will help you get the most out of it. The focus is on doing—building real projects, planning them, and executing them effectively. From simple bar charts to complex interactive dashboards, this book covers everything you need to create professional-grade visualizations that work across modern browsers.
Key Highlights
- Practical, hands-on recipes: Each recipe is a self-contained project that you can adapt and reuse in your own work.
- Progressive learning path: Start with basic concepts and gradually move to advanced techniques like animation, interactivity, and real-time data updates.
- Open source tools: Learn to leverage free libraries and frameworks to accelerate development without expensive licenses.
- Canvas and JavaScript focus: Deep dive into the HTML5 Canvas API for pixel-level control over graphics, combined with JavaScript for logic and data handling.
- Indian context friendly: The examples are universal, making them ideal for students in Indian colleges and professionals working on local or global projects.
Inside the Book
The book is divided into clear chapters that build on each other. Early chapters introduce the Canvas element, drawing primitives, and basic chart types like line and bar charts. Mid-level chapters explore interactivity—adding tooltips, click events, and animations that respond to user input. Advanced sections cover real-time data streaming, integration with open source charting libraries, and optimization techniques for large datasets. Each recipe includes a problem statement, a solution, and a detailed explanation of the code, ensuring you not only copy but also understand the logic behind the visualizations. By the end, you will have a portfolio of reusable chart components that you can customize for any project.
Key Topics
- Drawing shapes, paths, and gradients with the Canvas API
- Building bar, line, pie, and scatter charts from scratch
- Adding animations, transitions, and hover effects
- Handling user interactions like clicks, drags, and touches
- Integrating with open source libraries such as D3.js and Chart.js
- Working with real-time data from APIs or local sources
- Optimizing performance for large datasets
- Creating responsive and mobile-friendly visualizations
Reader Benefits
By reading this book, you will gain the confidence to create interactive charts and graphs without relying on expensive proprietary tools. You will learn to think visually and translate data into compelling stories that engage your audience. The cookbook format saves time—each recipe is a proven solution you can implement immediately. Indian students will find the content aligned with modern web development curricula, while working professionals can enhance their portfolios with cutting-edge skills. The hardcover edition is durable, making it a lasting reference for your desk or library.
Learning Outcomes
- Master the HTML5 Canvas API to draw custom graphics programmatically
- Build a variety of chart types, from simple to complex, with clean JavaScript code
- Add interactivity and animation to make data exploration intuitive
- Integrate open source tools to speed up development and add advanced features
- Optimize visualizations for performance and cross-browser compatibility
- Plan and execute data visualization projects from concept to deployment
Who Should Read
This book is perfect for web developers who want to add data visualization to their skill set. It is also ideal for students in computer science, information technology, or data science programs who need practical experience with HTML5 and JavaScript. If you are a designer looking to create interactive prototypes, or a data analyst who wants to present findings in a more engaging way, this cookbook will give you the tools you need. Basic knowledge of HTML and any programming language (preferably JavaScript) is assumed, but no prior Canvas or visualization experience is required.
About the Author
Ben Fhala is a seasoned web developer, educator, and author with a passion for data visualization and interactive design. He has years of experience building complex web applications and teaching others how to harness the power of HTML5 and JavaScript. Ben’s approach is practical and project-oriented, ensuring that readers gain real-world skills they can apply immediately. His other works include books on JavaScript and front-end development, and he is known for making advanced topics accessible to learners at all levels.
About the Publisher
Packt Publishing is a leading global publisher of technical books and learning resources. Based in the UK, Packt focuses on delivering practical content for IT professionals, developers, and students. Their cookbook series is especially popular for its hands-on, recipe-based approach that helps readers solve real problems quickly. Packt’s commitment to quality and relevance makes them a trusted name in the tech community, and this book is a fine example of their dedication to empowering learners worldwide.
Conclusion
HTML5 Graphing and Data Visualization Cookbook is more than just a technical manual—it is a creative toolkit that unlocks the power of data storytelling. With its clear recipes, progressive structure, and focus on open source tools, this book will help you turn numbers into narratives that captivate and inform. Whether you are a student in Bangalore, a developer in Mumbai, or a freelancer in Delhi, this hardcover edition is a valuable investment in your professional growth. Order your copy from Bookshops.in today and start building interactive charts that make an impact.
Quick Summary
HTML5 Graphing and Data Visualization Cookbook by Ben Fhala is a practical, project-driven guide for Indian web developers who want to create interactive charts and graphs using HTML5 Canvas, JavaScript, and open source tools. The book is organized linearly, allowing readers to follow from start to finish or jump to specific recipes. It assumes basic HTML and coding knowledge (preferably JavaScript) but does not require prior experience with Canvas or data visualization. Readers will learn to build dynamic, animated, and real-time visualizations such as bar charts, line graphs, pie charts, and scatter plots. Each recipe includes clear steps, code snippets, and explanations that help plan and execute complete projects. This cookbook is ideal for students, freelancers, and professionals looking to add engaging data graphics to their websites or portfolios. By purchasing from Bookshops.in, you get a reliable physical copy delivered to your doorstep, supporting India's trusted bookstore for quality educational resources.
Book Highlights
Book Specifications
| ISBN-13 | 9781849693707 |
| ISBN-10 | 1849693706 |
| Publisher | Packt Pub Ltd |
| Language | English |
| Dimensions | 19.05 x 1.98 x 23.5 cm |
| Weight | 590 g |
| Country | India |
| Category | Programming & Software Development › Languages |
| Genre | Non-fiction |
| Original Language | English |
Frequently Asked Questions
Do I need prior HTML5 experience to use this book?
What kind of charts can I create with this cookbook?
Is this book suitable for Indian students?
Does the book cover open source tools?
Can I use the code for commercial projects?
How is this book different from online tutorials?
Is there a focus on mobile-friendly charts?
Is this book available in hardcover?
Can beginners with no coding background use this?
Does the book include real-world project examples?
What is the price of this book in India?
Who is the author Ben Fhala?
How can I buy this book?
Readers Also Search For
Customers Also Bought

Programming
Algorithmische Sprache Und Programmentwicklung | by H. Partsch | F. L. Bauer | P. Pepper | Springer | by H. Partsch | F. L. Bauer | P. Pepper | Springer | by H. Partsch | F. L. Bauer | P. Pepper | Springer | by H. Partsch | F. L. Bauer | P. Pepper | Springer | by H. Partsch | F. L. Bauer | P. Pepper | Springer | by H. Partsch | F. L. Bauer | P. Pepper | Springer | by H. Partsch | F. L. Bauer | P. Pepper | Springer | by H. Partsch | F. L. Bauer | P. Pepper | Springer | by H. Partsch | F. L. Bauer
Programming
Distributed Algorithms | by Jean-Claude Bermond | Michel Raynal | Springer | by Jean-Claude Bermond | Michel Raynal | Springer | by Jean-Claude Bermond | Michel Raynal | Springer | by Jean-Claude Bermond | Michel Raynal | Springer | by Jean-Claude Bermond | Michel Raynal | Springer | by Jean-Claude Bermond | Michel Raynal | Springer | by Jean-Claude Bermond | Michel Raynal | Springer | by Jean-Claude Bermond | Michel Raynal | Springer | by Jean-Claude Bermond | Michel Raynal | Springer | by Jean
Programming
Meta-Level Control for Deductive Database Systems | by Helmut Schmidt | Springer | by Helmut Schmidt | Springer | by Helmut Schmidt | Springer | by Helmut Schmidt | Springer | by Helmut Schmidt | Springer | by Helmut Schmidt | Springer | by Helmut Schmidt | Springer | by Helmut Schmidt | Springer | by Helmut Schmidt | Springer | by Helmut Schmidt | Springer | by Helmut Schmidt | Springer | by Helmut Schmidt | Springer | by Helmut Schmidt | Springer | by Helmut Schmidt | Springer | by Helmut Schm
Programming
Java Web Services | by David A. Chappell | Tyler Jewell | O'Reilly Media | by David A. Chappell | Tyler Jewell | O'Reilly Media | by David A. Chappell | Tyler Jewell | O'Reilly Media | by David A. Chappell | Tyler Jewell | O'Reilly Media | by David A. Chappell | Tyler Jewell | O'Reilly Media | by David A. Chappell | Tyler Jewell | O'Reilly Media | by David A. Chappell | Tyler Jewell | O'Reilly Media | by David A. Chappell | Tyler Jewell | O'Reilly Media | by David A. Chappell | Tyler Jewell | O'
Programming
Database in Depth | by Chris J. Date | O'Reilly Media | by Chris J. Date | O'Reilly Media | by Chris J. Date | O'Reilly Media | by Chris J. Date | O'Reilly Media | by Chris J. Date | O'Reilly Media | by Chris J. Date | O'Reilly Media | by Chris J. Date | O'Reilly Media | by Chris J. Date | O'Reilly Media | by Chris J. Date | O'Reilly Media | by Chris J. Date | O'Reilly Media | by Chris J. Date | O'Reilly Media | by Chris J. Date | O'Reilly Media | by Chris J. Date | O'Reilly Media | by Chris J.

Programming
Integration of AI and OR Techniques in Constraint Programming for Combinatorial Optimization Problem | by Nicolas Beldiceanu | Narendra Jussien | Eric Pinson | Springer | by Nicolas Beldiceanu | Narendra Jussien | Eric Pinson | Springer | by Nicolas Beldiceanu | Narendra Jussien | Eric Pinson | Springer | by Nicolas Beldiceanu | Narendra Jussien | Eric Pinson | Springer | by Nicolas Beldiceanu | Narendra Jussien | Eric Pinson | Springer | by Nicolas Beldiceanu | Narendra Jussien | Eric Pinson |
Related Products
View All
Computers & Internet
Modern Full-Stack React Projects by Daniel Bugl
Computers & Internet
Mootools 1.2 Beginner's Guide (English, Jacob Gube)
Computers & Internet
Contemporary Methods for Speech Parameterization (Springerbriefs in Electrical and Computer Engineering / Springerbriefs in Speech Technology)

Computers & Internet
Information Technology and Lawyers | by Arno R. Lodder | Anja Oskamp | Springer | by Arno R. Lodder | Anja Oskamp | Springer | by Arno R. Lodder | Anja Oskamp | Springer | by Arno R. Lodder | Anja Oskamp | Springer | by Arno R. Lodder | Anja Oskamp | Springer | by Arno R. Lodder | Anja Oskamp | Springer | by Arno R. Lodder | Anja Oskamp | Springer | by Arno R. Lodder | Anja Oskamp | Springer | by Arno R. Lodder | Anja Oskamp | Springer | by Arno R. Lodder | Anja Oskamp | Springer | by Arno R. Lo

Computers & Internet
Digital Analysis of Remotely Sensed Imagery | by Jay Gao | McGraw-Hill Companies | by Jay Gao | McGraw-Hill Companies | by Jay Gao | McGraw-Hill Companies | by Jay Gao | McGraw-Hill Companies | by Jay Gao | McGraw-Hill Companies | by Jay Gao | McGraw-Hill Companies | by Jay Gao | McGraw-Hill Companies | by Jay Gao | McGraw-Hill Companies | by Jay Gao | McGraw-Hill Companies | by Jay Gao | McGraw-Hill Companies | by Jay Gao | McGraw-Hill Companies | by Jay Gao | McGraw-Hill Companies | by Jay Gao
Computers & Internet